Full-Stack & AI Systems · /churn-graph
Churn Graph
Churn Early-Warning Context Graph with Evidence-Cited AI Answers
- Role:
- Backend Developer
- Team:
- Hackathon team of 3 (Road to PENS Hackathon 2026)
A Next.js and Neo4j hackathon app that unifies six customer-data sources into one context graph to rank accounts by churn risk, with clickable evidence paths and AI answers that cite graph records.
Overview
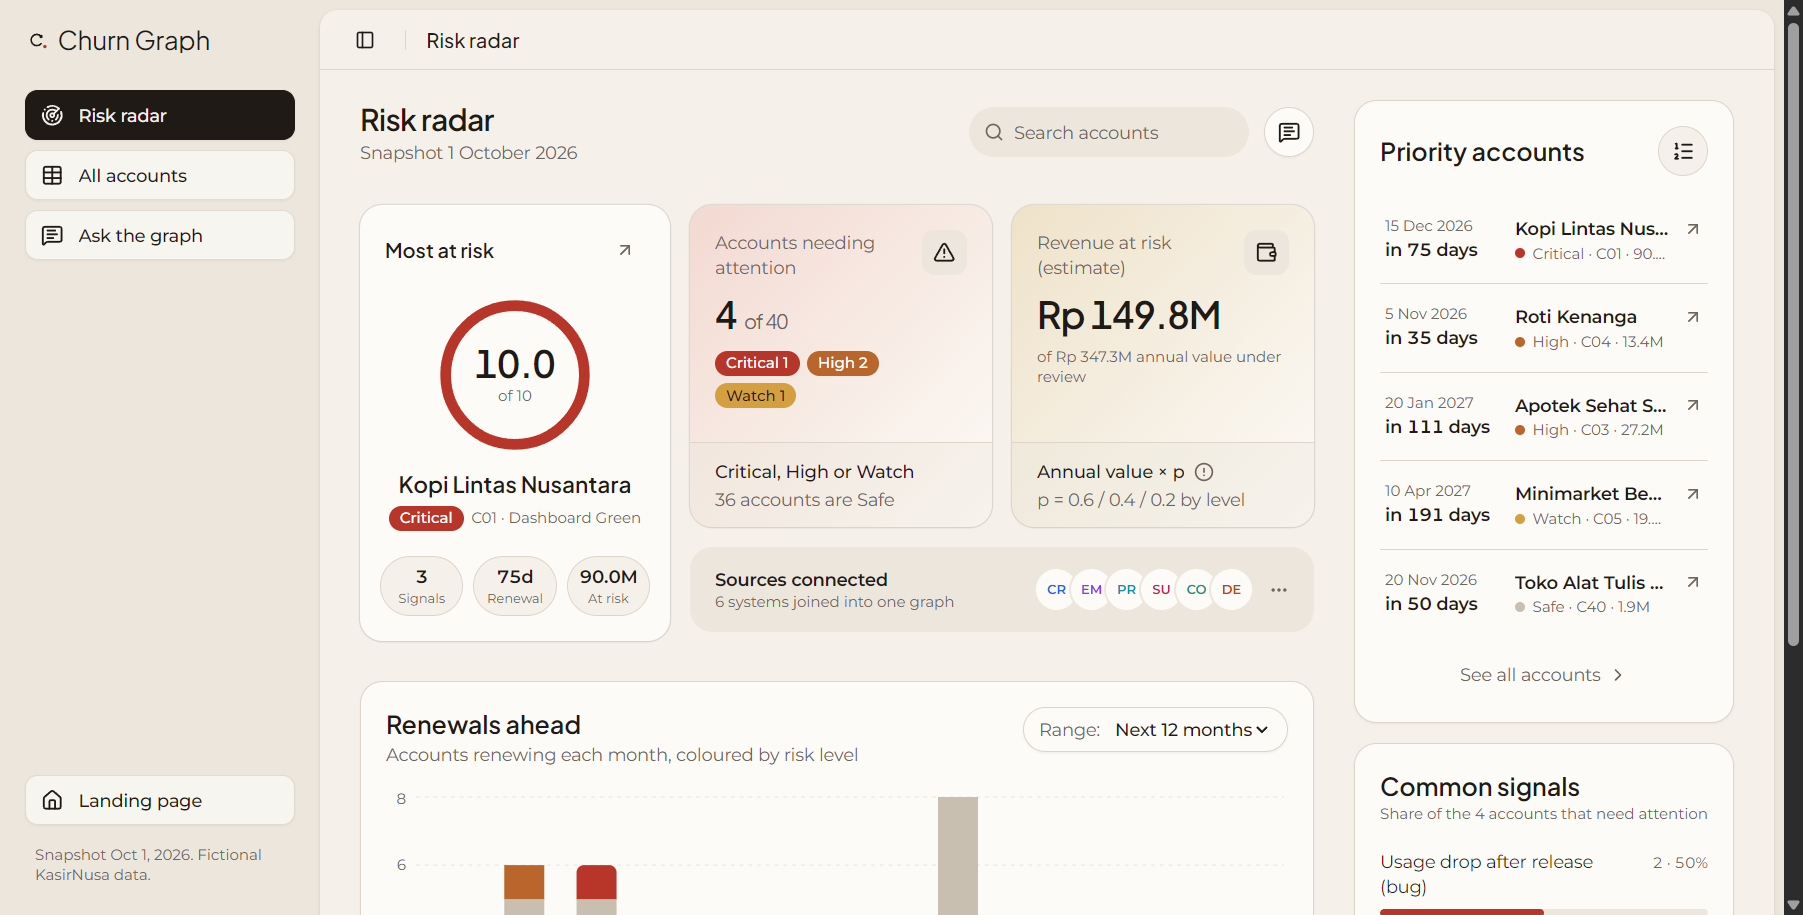
Churn Graph was built by a three-person team at the Road to PENS Hackathon 2026 for a case-study SaaS company whose customer-success team could not tell which accounts would really churn before renewal: the dashboard health score misjudged accounts, and the evidence was scattered and contradictory across six systems (CRM, email and meetings, product usage, support tickets, contracts and billing, and a decision log). The app loads those sources into a single Neo4j context graph, detects risk signals and places where the sources disagree, ranks accounts by risk with clickable evidence, suggests retention actions with precedents from the decision log, and answers ad-hoc questions with citations back to graph records.
My Contributions
- Role: Backend Developer. The team's PRD assigns me ownership of Backend & AI, while teammates owned the data-graph / ETL pipeline and the frontend, pitch, and demo. The items below are traceable to my own commits.
- Backend foundation: integrated the Neo4j driver with a read-session query helper, environment configuration, and a health-check route, plus a Google Gemini connectivity spike.
- Cypher query guard: a pure validation function that rejects write and other dangerous clauses (matched on word boundaries while ignoring strings and comments), refuses multi-statement queries, and caps LIMIT, layered on top of the driver's read-only sessions; together with Zod schemas for the shared graph types.
- Citation validator: checks every claim in an AI answer against the registry of records the tools actually returned, discarding any claim whose cited evidence or numbers cannot be matched.
- Risk scoring and ranking: score = Σ signal weight × a renewal-proximity factor, mapped to risk levels, and flagging accounts the dashboard marks green while the findings rate them high.
- Initial Ask Graph pipeline: the POST /api/ask route, six fixed parameterised graph tools so the model never writes Cypher, the system prompt, preset questions, and an evaluation script.
- Testing: each of these shipped with unit tests; several modules were later extended by teammates.
Problem
The customer-success team relied on a dashboard health score that rated several at-risk accounts as healthy. The signals that explained the risk (a departed champion, a competitor mention, an unkept feature promise, unanswered renewal emails, late payments) lived in separate systems, and some looked negative only out of context, such as a usage drop caused by a sync bug rather than a customer leaving.
Solution
- Context graph: six raw sources reconciled by an ETL pipeline and loaded into Neo4j.
- Risk signals: Cypher rules for patterns such as a departed champion, broken promises, competitor mentions, unanswered outreach, payment risk, and usage anomalies tied to release bugs.
- Risk ranking: accounts scored and ranked, with evidence paths and source-versus-source comparison cards.
- Retention actions: suggested actions that reference precedents in the decision log.
- Ask Graph (Tanya Graph): natural-language questions answered by an LLM that can only use fixed, parameterised graph tools, with every claim checked against the records it cites.
Architecture & Core Systems
- Next.js App Router application with API routes for questions (/api/ask), evidence, and health checks.
- Neo4j AuraDB accessed through neo4j-driver read sessions; signal rules and schema written in Cypher.
- TypeScript ETL scripts (run with Bun) that clean, resolve, derive, and load the raw CSV / JSONL data into the graph.
- AI layer built on the Vercel AI SDK with Google Gemini and an OpenAI-compatible fallback provider.
- Frontend dashboard with a React Flow evidence-subgraph viewer, Recharts usage charts, and shadcn/ui components.
Results
Built during the Road to PENS Hackathon 2026 and deployed on Vercel; the source is public on GitHub.
Screenshots & Preview
Visual assets and captures from Churn Graph. Click any image to open the full-resolution preview.